
Understanding the Cost and Revenue Diagram
Understanding the Cost and Revenue Diagram
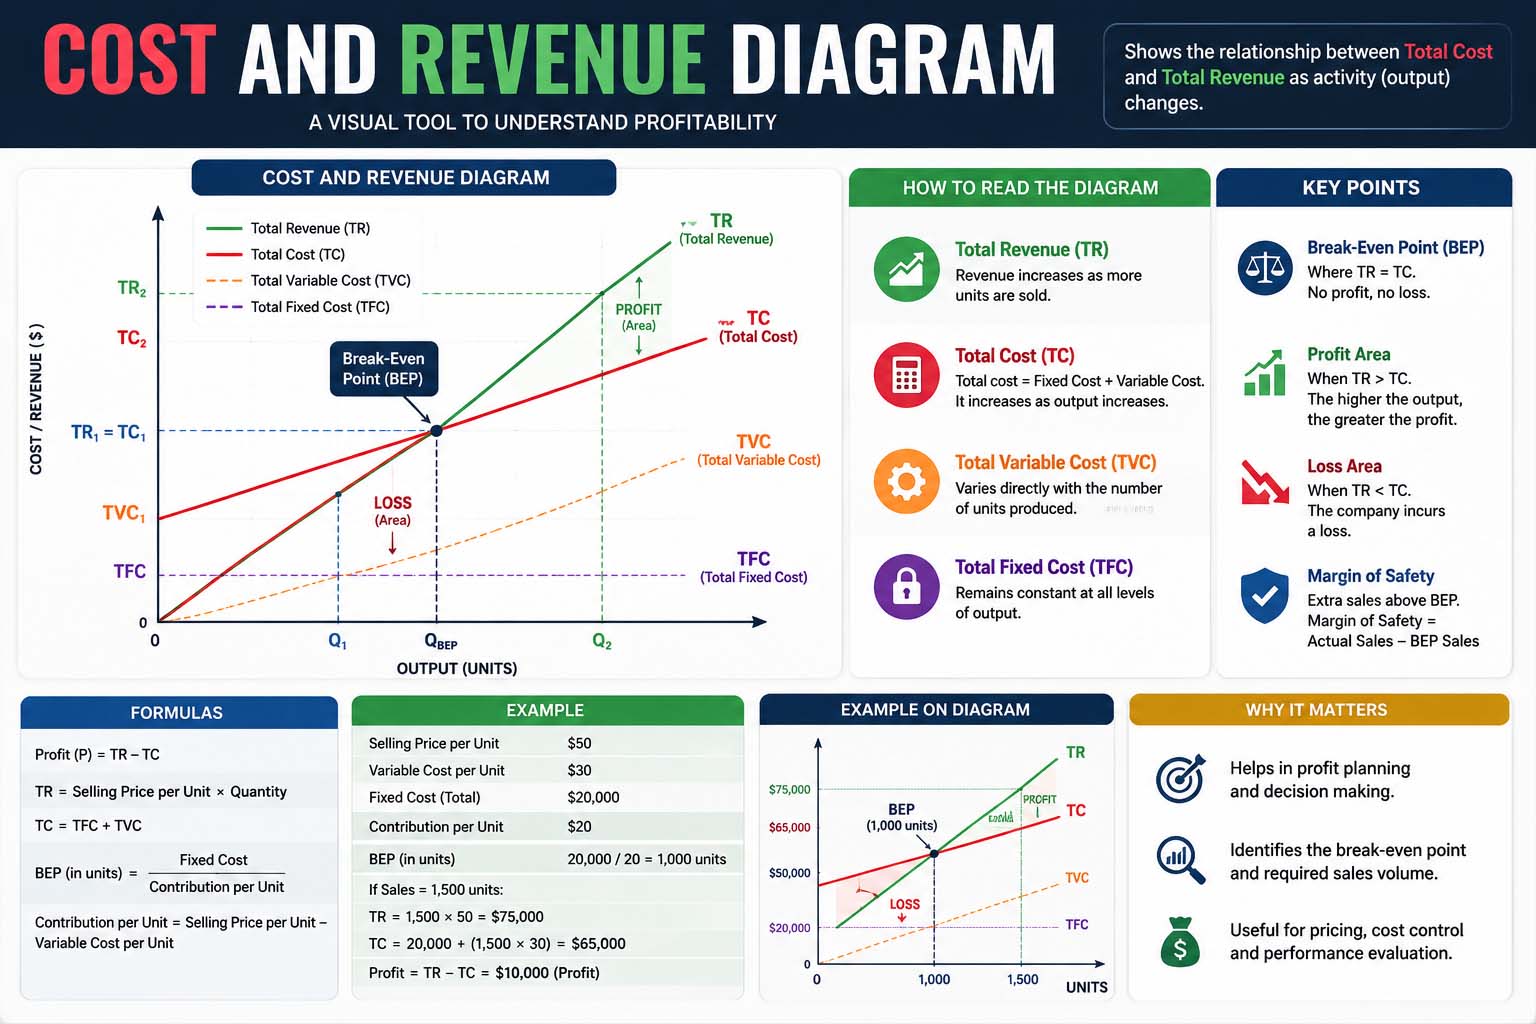
The concept of a cost and revenue diagram is one of the most important topics in economics because it helps explain how businesses make decisions about production, pricing, and profit. Schools, colleges, and universities widely use these diagrams to show the relationship between costs, revenues, and output levels. By understanding these economic models, students and business professionals can better analyze how firms operate in different market structures.
A cost and revenue diagram usually includes curves such as total cost, average cost, marginal cost, total revenue, average revenue, and marginal revenue. These curves help economists determine whether a business is making a profit, breaking even, or experiencing losses. The diagrams also explain how firms choose the most efficient output level to maximize profits.
In modern economics education, these diagrams matter because they turn complex business concepts into simple visuals. Students studying microeconomics often meet these models when learning about perfect competition, monopoly markets, and business efficiency.
Cost and Revenue Diagram A Level Economics
The topic of cost and revenue diagram a level economics is especially important for students preparing for advanced economics exams. At the A Level stage, students need to understand how businesses calculate profits and losses using graphical analysis.
A standard diagram typically includes several curves that represent different economic concepts. The average cost curve shows the cost per unit of production, while the marginal cost curve represents the extra cost of producing one more unit. Revenue curves show how much income the business earns from selling products.
Students often learn that profit maximization occurs where marginal cost equals marginal revenue. Economists consider this point the most efficient output level because producing beyond it can reduce profitability. Understanding this principle is essential for answering exam questions and analyzing business behavior.
Teachers frequently use real-world examples to help students understand how firms apply these concepts. For example, manufacturing companies must constantly compare production costs with expected revenues to stay profitable. Businesses that fail to manage costs effectively may struggle to survive in competitive markets.
A Level economics students also study how these diagrams change with market conditions. Perfect competition and monopoly markets have different revenue curves, so it is important to understand the unique features of each structure.
Cost and Revenue Diagram Economics
The study of cost and revenue diagram economics helps explain how businesses allocate resources and make strategic decisions. Economists use these diagrams to analyze efficiency, profitability, and market behavior across different industries.
Economists generally divide costs into fixed costs and variable costs. Fixed costs remain constant regardless of production levels, while variable costs change with output. Total cost combines both fixed and variable costs, giving businesses a complete picture of their expenses.
On the revenue side, total revenue rises as a firm sells more units, although the rate of increase may vary with market demand and pricing strategies.
These diagrams are particularly useful because they provide a visual way to understand business operations. Instead of relying only on mathematical calculations, economists can observe patterns and relationships between different curves.
In economics, businesses aim to maximize profits by finding the ideal balance between costs and revenues. If production costs become too high relative to revenue, profits decline. On the other hand, if firms manage costs efficiently while maintaining strong sales, profitability improves significantly.
Economies of Scale and Average Costs
Understanding Minimum Efficient Scale helps explain the level of output where businesses can achieve the lowest possible average costs while operating efficiently.
As firms continue expanding production, they may face challenges such as Diseconomies of Scale, where increasing size causes average costs to rise due to inefficiencies.
Students studying cost and revenue diagram economics a level need strong analytical skills and a clear grasp of the theory behind business decision-making. This topic forms a core part of microeconomics because it explains how firms behave under different market conditions.
Teachers at this level also cover economies of scale. As firms increase production, average costs may at first decrease due to greater efficiency. However, beyond a certain point, diseconomies of scale can occur, causing average costs to rise again. This creates the U-shaped average cost curve that appears in many diagrams.
Another key concept involves the relationship between marginal cost and average cost. When marginal cost is below average cost, the average cost curve falls. When marginal cost rises above average cost, the average cost curve begins to increase. Understanding this relationship helps students read diagrams accurately during exams.
Revenue analysis is equally important in A Level economics. In perfectly competitive markets, firms are price takers, meaning average revenue and marginal revenue remain constant. In monopoly markets, however, marginal revenue declines faster than average revenue because monopolists must lower prices to sell additional units.
Monopoly Cost and Revenue Diagram
Different market structures can also influence pricing behavior, and concepts such as the Kinked Demand Curve help explain how firms respond to competitor actions in oligopoly markets.
A monopoly cost and revenue diagram differs significantly from diagrams for perfectly competitive markets. In a monopoly, a single firm dominates the market, giving it significant control over prices and output levels.
The monopolist faces a downward-sloping demand curve because consumers buy more products only when prices decrease. As a result, the average revenue curve slopes downward, and the marginal revenue curve falls even faster below it.
Profit maximization for a monopoly still occurs where marginal cost equals marginal revenue. However, monopolists often produce lower output levels and charge higher prices compared to competitive firms. This allows them to earn abnormal profits in the long run. For a step-by-step explanation, OpenStax shows how a profit-maximizing monopoly chooses output and price.
Monopoly diagrams are important because they show how market power affects consumers and economic efficiency. Economists often criticize monopolies for reducing consumer choice and charging excessively high prices. However, supporters argue that monopolies can achieve large-scale efficiencies and invest heavily in innovation.
Why This Analysis Matters for Businesses
Businesses can also use financial analysis alongside concepts like the Product Life Cycle to make better decisions about growth, investment, and long-term strategy.
The study of the cost and revenue diagram remains essential in economics because it explains how businesses make rational decisions in competitive markets. These diagrams help students, economists, and business owners understand the balance between production costs and income generation.