
Tag: cost and revenue diagram economics
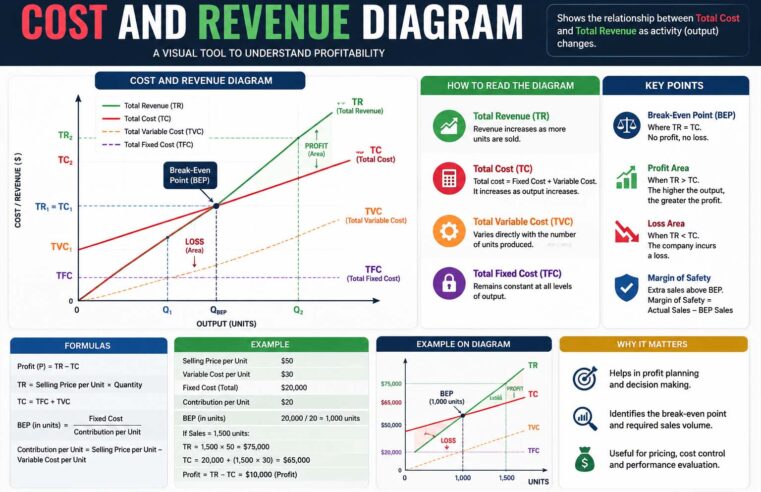
Understanding the Cost and Revenue Diagram
The concept of a cost and revenue diagram is one of the most important topics in economics because it helps explain how businesses make decisions regarding production, pricing, and profit.
Read More