
Kinked Demand Curve in Oligopoly Markets
Kinked Demand Curve in Oligopoly Markets
The concept of the kinked demand curve is one of the most important theories in microeconomics, especially when discussing pricing behavior in oligopoly markets. Economists developed this model to explain why prices in certain industries remain stable even when production costs or market conditions change. The kinked demand curve theory focuses on how firms react to competitors in markets where only a few companies dominate. Understanding this concept helps students, business owners, and economists analyze real-world pricing strategies in industries such as airlines, telecommunications, automobiles, and fuel markets.
Kinked Demand Curve Oligopoly
The idea of a kinked demand curve oligopoly is closely connected with markets where a small number of firms compete against each other. In an oligopoly, each company must consider the actions of rival firms before changing prices because every pricing decision can influence the entire market. The kinked demand curve model explains that firms believe competitors will react differently depending on whether prices rise or fall.
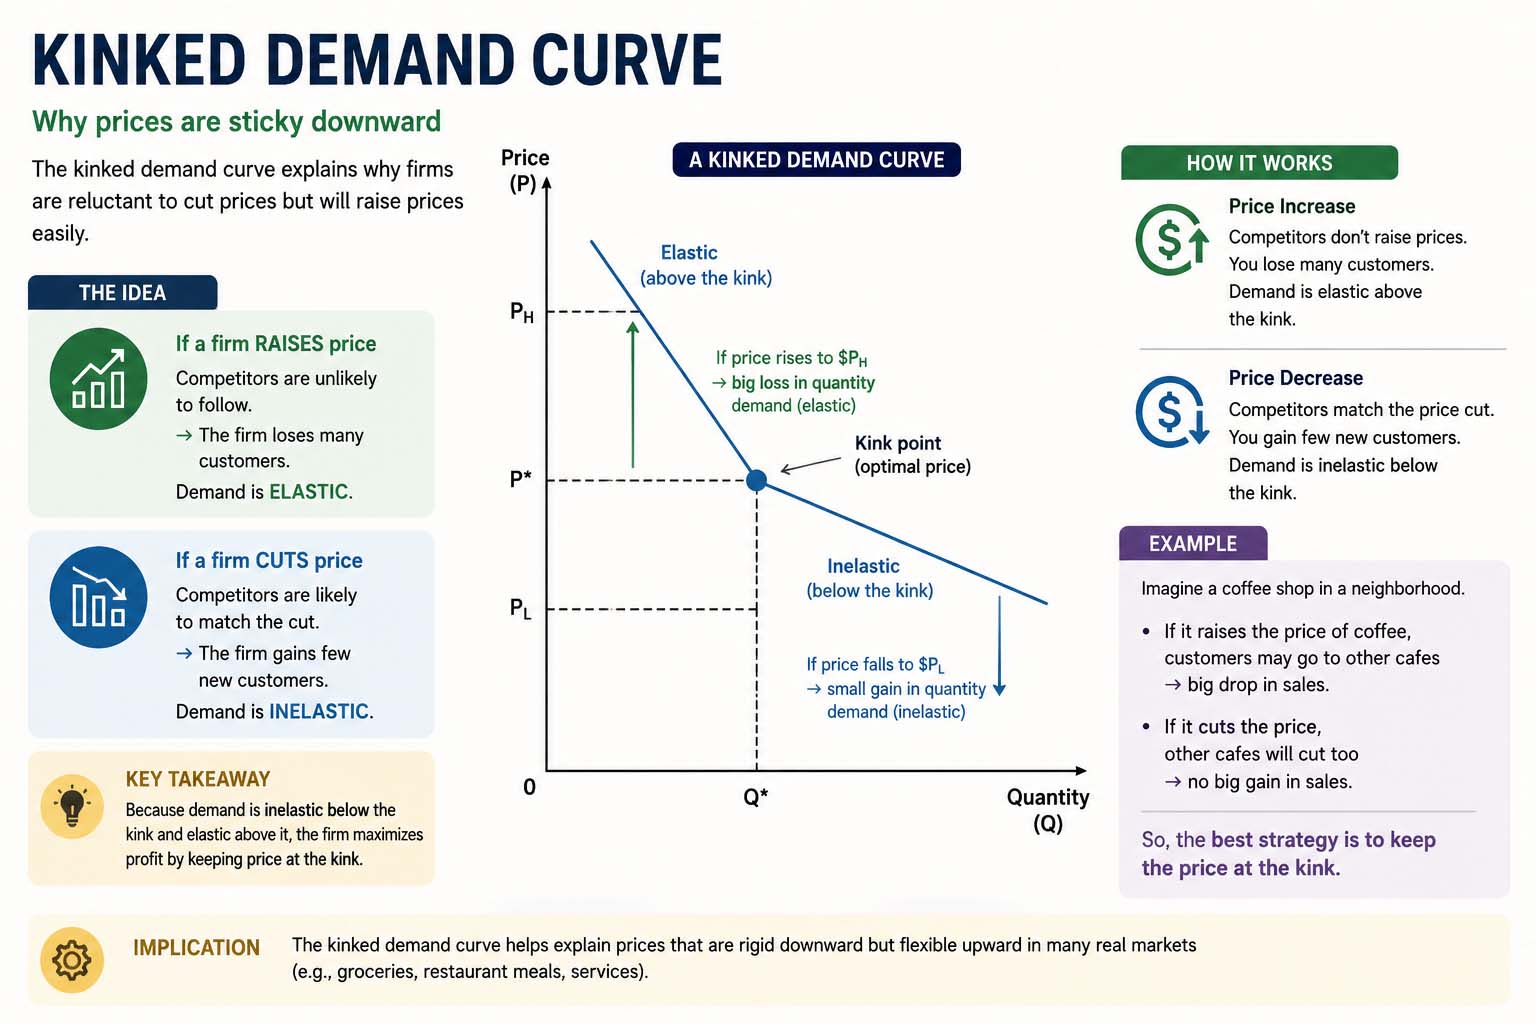
If one company increases its prices, competitors may refuse to follow the increase. Customers will then shift to cheaper alternatives, causing the firm that raised prices to lose significant market share. As a result, demand above the current price level becomes highly elastic because consumers quickly respond to price increases.
On the other hand, if a company lowers its prices, competitors are likely to match the decrease to protect their own market share. Since all firms reduce prices together, the increase in demand for the original company is relatively small. In this case, demand below the current price becomes inelastic because consumers do not dramatically increase purchases when all firms charge similar prices.
The theory suggests that firms prefer maintaining stable prices because changing prices may lead to undesirable outcomes such as losing customers or starting price wars. This price rigidity is one of the key features of oligopoly markets.
Oligopoly Kinked Demand Curve
The oligopoly kinked demand curve theory was introduced by economist Paul Sweezy in the 1930s. The model became popular because it provided a practical explanation for price stability in industries dominated by a few firms. In perfect competition, prices frequently change according to supply and demand conditions. However, in oligopolistic industries, prices often remain fixed for long periods.
The model assumes that firms are interdependent. This means each business closely watches competitors and adjusts strategies accordingly. Firms understand that aggressive pricing actions can trigger strong responses from rivals, which may harm profits across the entire industry.
An important feature of the oligopoly kinked demand curve is the discontinuity in marginal revenue. Because the demand curve has a kink, the marginal revenue curve develops a gap. Even if production costs change slightly within this gap, firms may not alter prices. This explains why prices remain sticky in many real-world markets.
For example, imagine two major smartphone manufacturers competing globally. If one company raises prices, customers may switch to the competitor’s products, reducing sales sharply. However, if one firm lowers prices, the competitor will likely match the reduction quickly, limiting the benefits of the price cut. Both companies may therefore prefer keeping prices stable instead of risking lower profits.
This theory also highlights the importance of non-price competition in oligopolies. Since firms hesitate to compete aggressively on price, they focus on advertising, branding, product quality, customer service, and innovation. Many large corporations spend billions on marketing campaigns because they know price competition can damage industry profits.
Kinked Demand Curve A Level Economics
The topic of the kinked demand curve A level economics is commonly studied by economics students because it introduces important ideas about market structures and firm behavior. It helps students understand why businesses in oligopolistic markets often avoid changing prices despite fluctuations in demand or costs.
At the A Level, students learn that the kinked demand curve consists of two segments. The upper segment is relatively elastic because consumers react strongly when a firm increases prices. The lower segment is relatively inelastic because competitors follow price decreases, limiting additional sales gains.
Students are also taught that the kink in the demand curve creates uncertainty for firms. Businesses cannot accurately predict competitors’ reactions to price changes, so maintaining the current price often appears to be the safest strategy. This creates price rigidity, which is one of the main conclusions of the model.
Another important aspect covered in kinked demand curve A level economics is the criticism of the theory. Some economists argue that the model explains price stability but does not explain how the original market price is determined. The theory assumes a current price already exists without describing how firms initially reached that level.
Kinked Demand Curve Diagram
The kinked demand curve diagram is an essential visual representation used to explain the theory. The diagram usually shows a demand curve with a noticeable bend or “kink” at the current market price. Above the kink, the demand curve is flatter, indicating elastic demand. Below the kink, the curve becomes steeper, representing inelastic demand.
y={−2x+20−0.5x+12.5x<5x≥5
The marginal revenue curve associated with the kinked demand curve contains a vertical gap directly below the kink. This discontinuity is one of the most important elements of the model because it explains why small cost changes may not lead to price changes.
In economics textbooks, the kinked demand curve diagram often includes labels for price, output, demand, and marginal revenue. The equilibrium point is located at the kink, where firms are reluctant to move away from the existing price.
Understanding the diagram helps students connect theoretical ideas with practical business behavior. For example, in gasoline markets, competing stations often maintain similar prices for extended periods. If one station raises prices, customers quickly choose cheaper alternatives nearby. If one station lowers prices, competitors usually respond immediately, reducing any competitive advantage.